Case study · observability
Grafana, Loki, Prometheus and Alloy, run as one stack
Centralized metrics and logs, dashboards defined as code, alert routing that reaches a human who can act — plus the recovery runbook from the day it broke.
The problem in one sentence. Host, container, database, reverse proxy, network and application signals each lived in their own tool, so every incident started with ten minutes of deciding where to look before anyone could start fixing anything.
What I built
- A containerized monitoring stack with persistent service configuration, brought up and torn down as one unit.
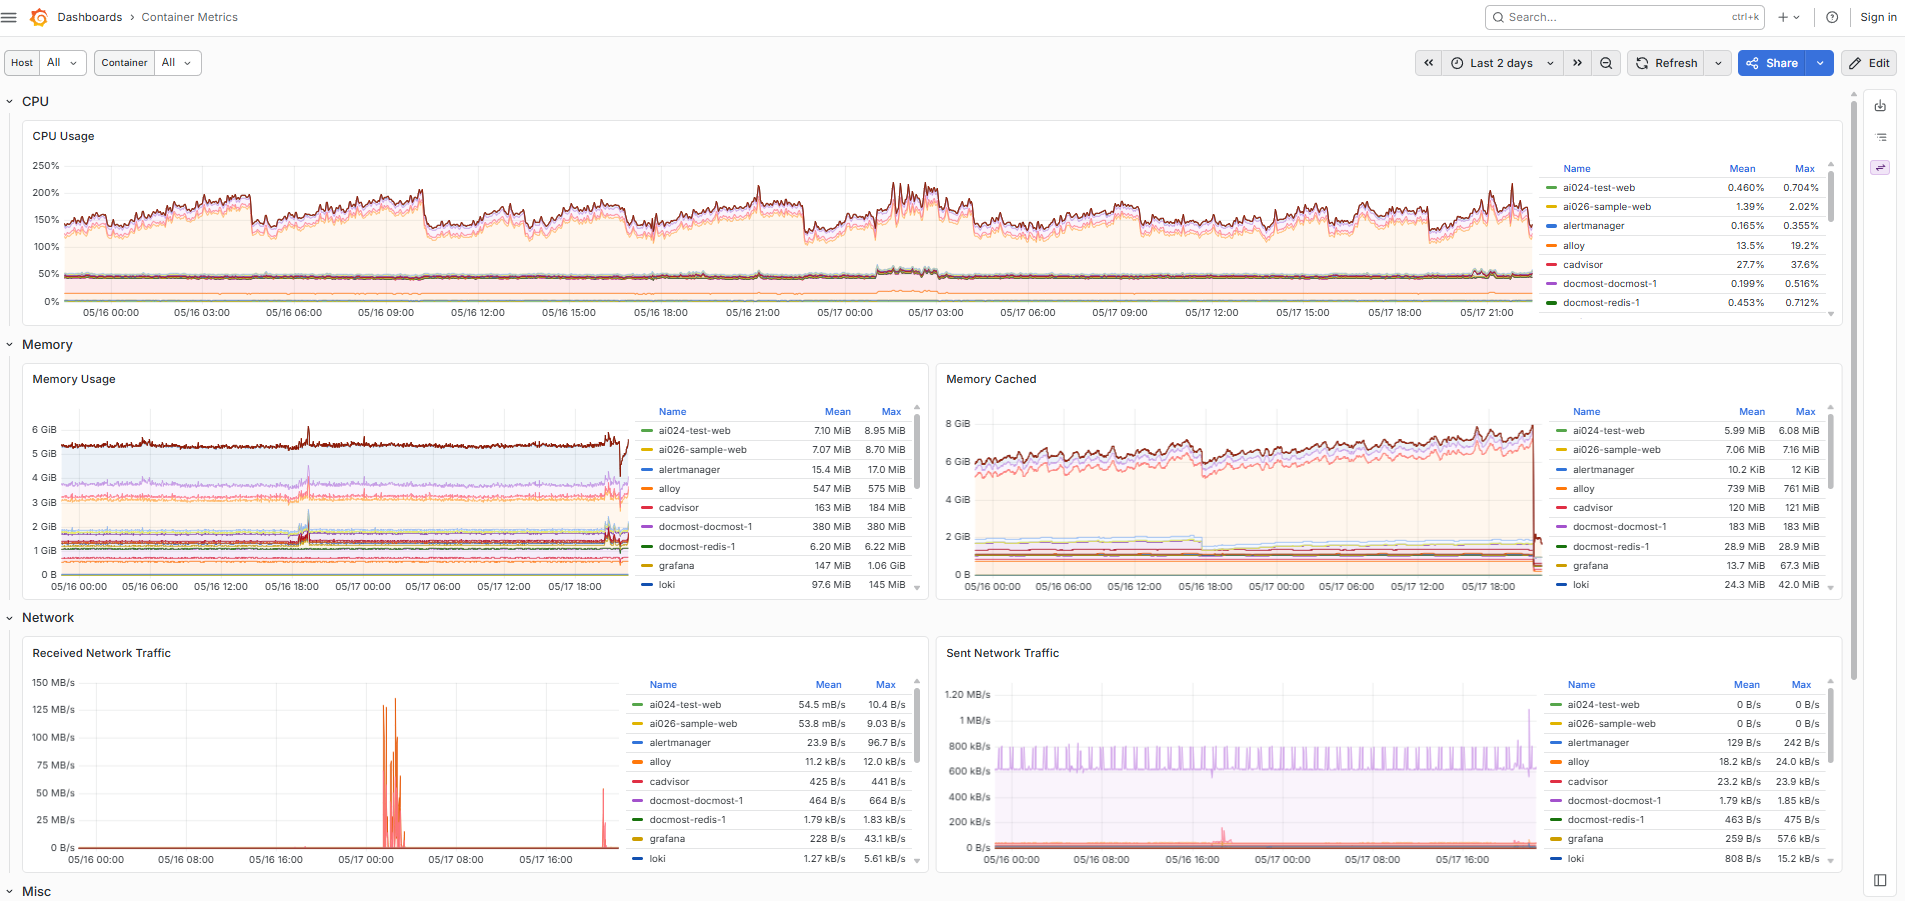
- Grafana dashboards provisioned from JSON in the repository, so a rebuild is a deploy rather than an afternoon of clicking.
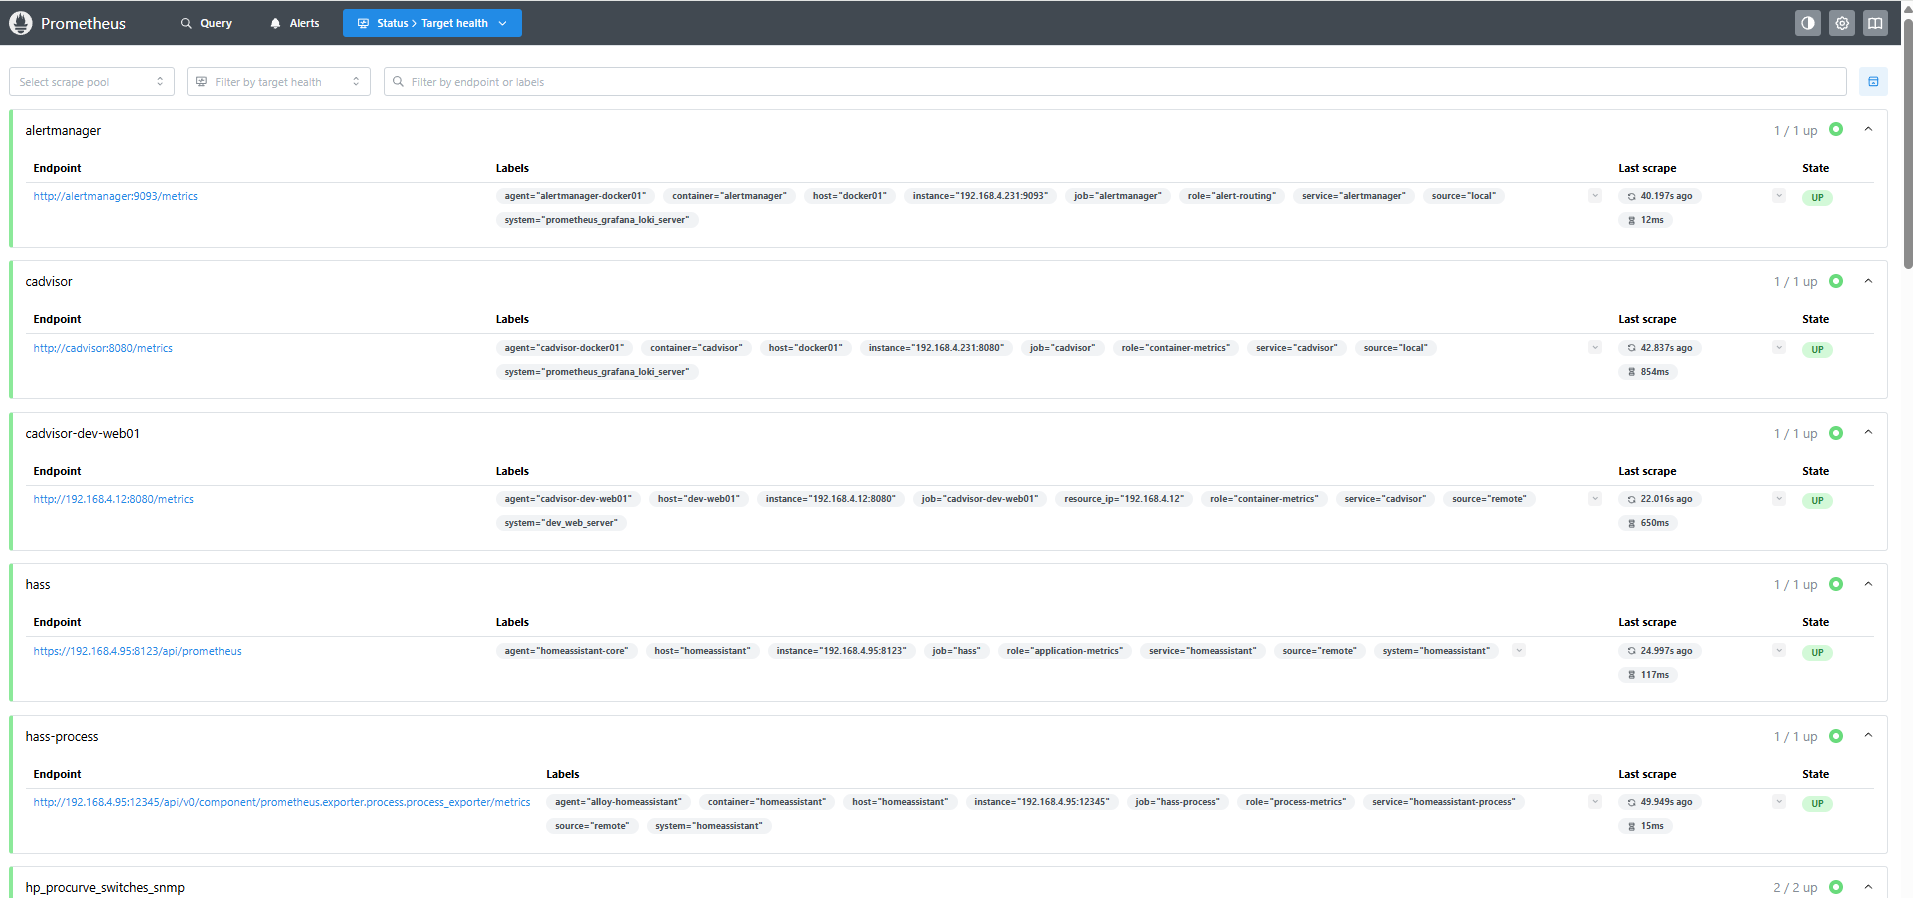
- Prometheus scrape coverage across hosts, containers, applications, databases, DNS, virtualization and network devices.
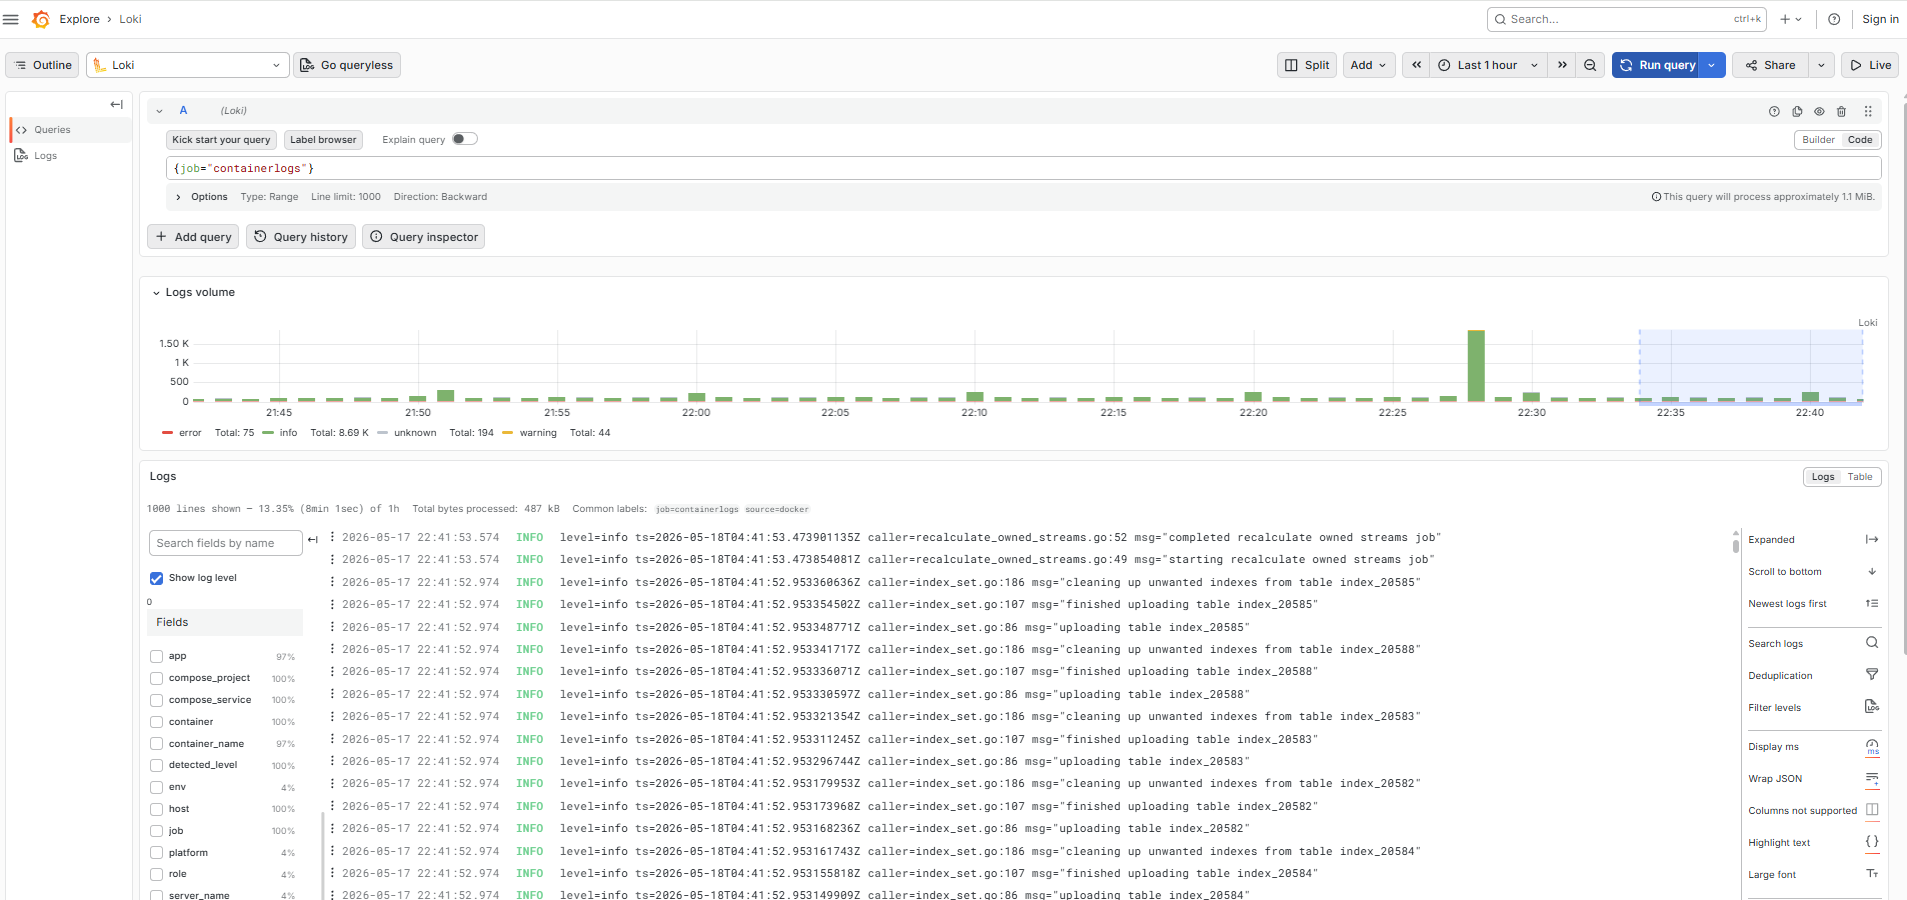
- Loki log aggregation through Alloy pipelines, using label conventions consistent with the metrics side so a query crosses both.
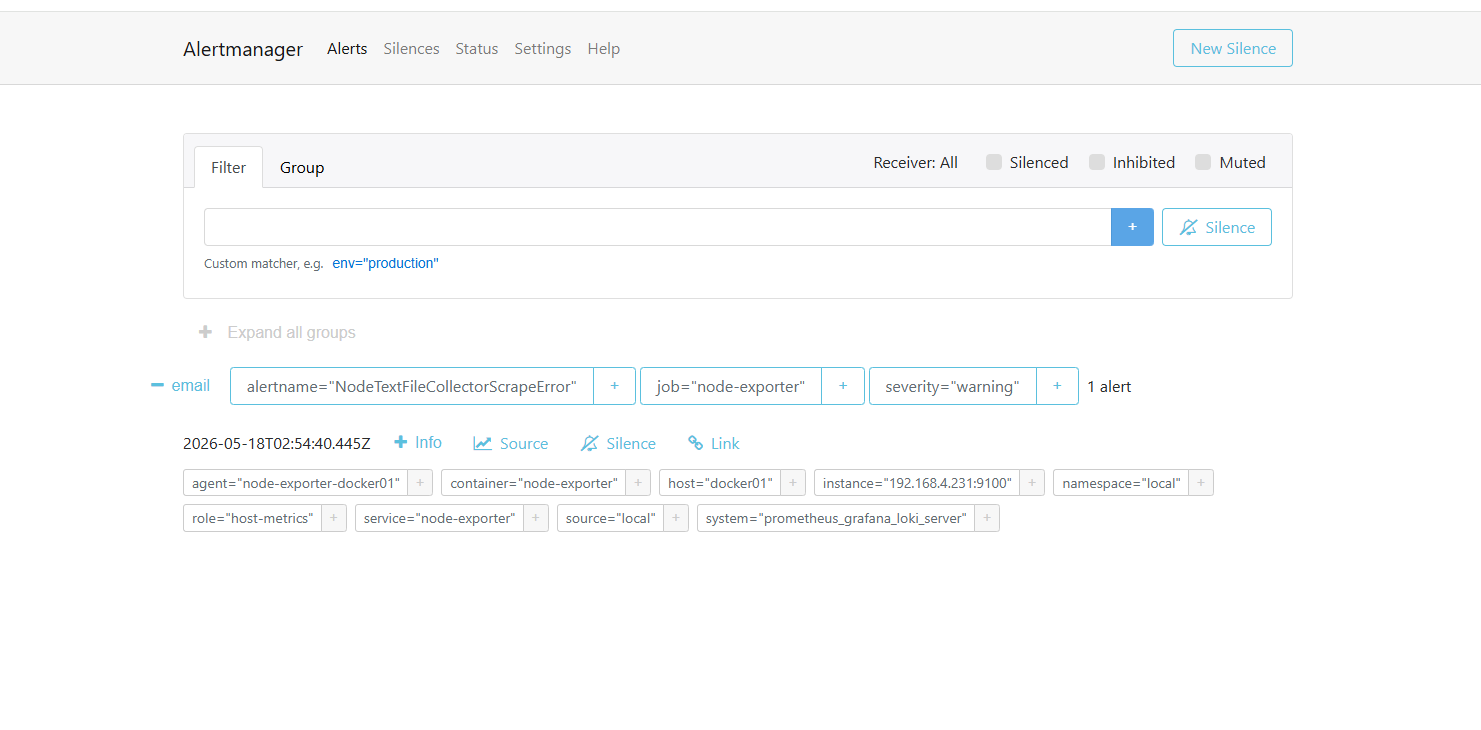
- Alertmanager routing with Prometheus and Loki rules written to page a person who can act, with the noisy ones deleted rather than muted.
- Startup and restart design so monitoring comes back cleanly after a reboot instead of half-recovering and lying about it.
- Architecture documentation, topology diagrams and onboarding notes, written for the person holding the pager at 3am.
How it is built
Source of truth
Configuration, dashboards, alert rules and documentation are tracked in Git. If it is not in the repository, it does not exist.
Dashboards as code
Grafana is provisioned from repository-managed JSON. Nobody's private dashboard becomes load-bearing.
Metrics and logs together
Prometheus and Loki give complementary views of the same event, so an incident is one query away rather than one tool away.
Recovery is designed
Restart policy and startup ordering are explicit, because partial recovery after a reboot is worse than none at all.
Evidence
Published as a cleaned public view. Open any image for full size.
Why it matters
Monitoring is easy to stand up and hard to keep honest. The work here is the part that survives contact with a real incident: labels that agree across tools, alerts somebody actually wants to receive, dashboards that can be rebuilt from source, and a documented path back when the monitoring stack is itself the thing that broke.
The same discipline scales. It is what I put in place for teams, and the reason I keep running one myself.